


Archive
Business Today Banking
&
Economy Summit

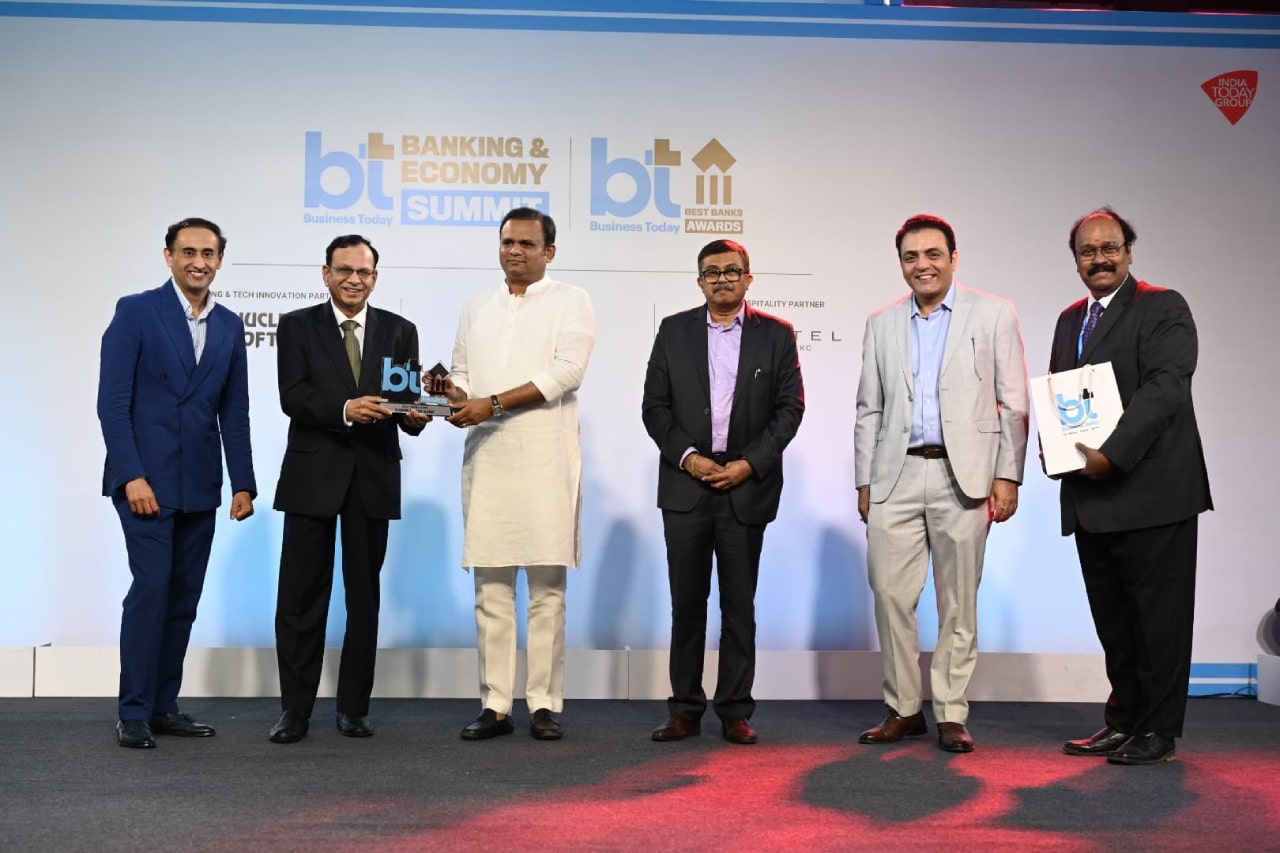
The Business Today Banking & Economy Summit is a gathering of banking luminaries and fintech trailblazers, precedes the unveiling of the special magazine issue.
The Summit Acknowledges & Rewards The Exceptional Achievements of Top Banks and Fintech Companies in India.
This recognition is based on a thorough evaluation process that incorporates both quantitative and qualitative factors from the BT KPMG Best Banks and Fintech Survey.
The summit includes insightful sessions led by renowned speakers from government, industry, and academia, attended by prominent bankers, financial institution leaders, and senior executives from the banking and financial industry in India.
Video Bytes
Glimpses


Highlights
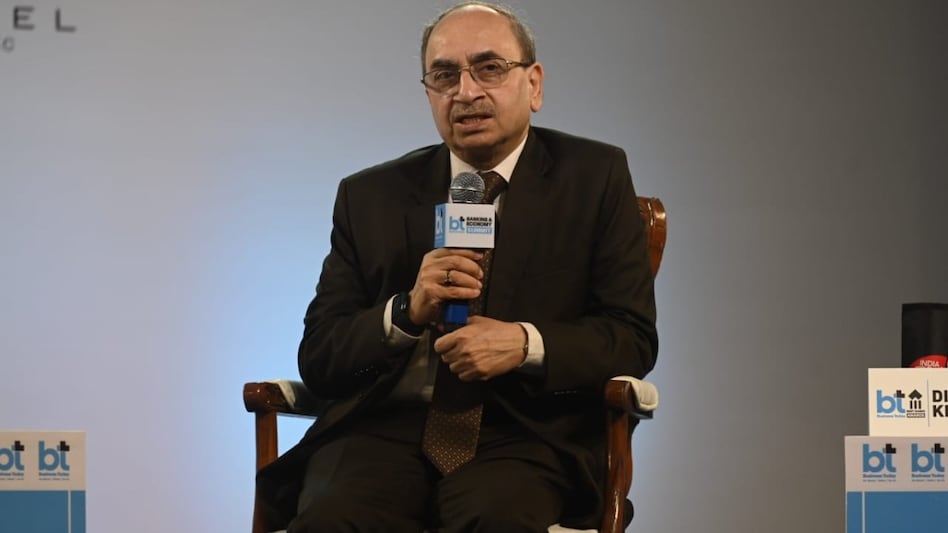
BT Tax rebate in Union Budget to boost deposits and consumption equally: SBI Chairman Dinesh Khara
The country's banking sector has undergone a sea change over the last decade. From digital transformation to the consolidation of public banks and the introduction of new private banks, banking in India has been dynamic and shock-resistant. Meanwhile, in recent quarters, it has faced challenges in terms of a shortage in deposits. That, however, is set to get a major boost with the Union Budget offering much-awaited relief in personal income tax, says former Chairman of State Bank of India Dinesh Khara.


Our Partners
-
Banking & Tech Innovation

-
Knowledge Partner

-
Hospitality Partner

Banks under pressure, margins at risk: Best Banks survey reveals top performers thriving amid turmoil
Banks are facing challenges on both sides of the balance sheet--assets as well as liabilities--which are putting pressure on margins. The 29th BT-KPMG Survey of India's Best Banks and NBFCs celebrates institutions that have thrived and excelled despite these challenges
read now
Cover Story


Categorical Ranking
Financials
Balance Sheet (₹ in crores)
Deposits
Total Deposits
8.5
Growth in Deposits
8.5
Operating Profit
Total Operating Profit
8.5
Growth in Operating Profit
8.5
Growth in Loans & Advances
8.5
Non Performing Assets
8.5
Ratios
Return on capital employed
8.5
Return on assets
8.5
Net interest margin
8.5
Rankings

with score

with score

with score
with score
with score
with score
Compare
Categorical Data
Financials
Balance Sheet (₹ in crores)
Loans
Impairment on Loans
8.5
Secured Loans
8.5
Operating Profit
Total Operating Profit
8.5
Growth in Operating Profit
8.5
CAR
8.5
Fraud
8.5
Ratios
Return on capital employed
8.5
Return on assets
8.5
Net interest margin
8.5
Rankings
with score
with score
with score
with score
with score
with score
Best Banks 2023

Institution builder, visionary: Deciphering Uday Kotak's incredible legacy
In a career spanning nearly four decades, Uday Kotak, a first-generation entrepreneur, has not only created a bank of size but also built an institution, which offers a wide range of financial services, from asset management and insurance to securities
read now
India's Best Banks
(2023)


Best Banks 2022

SBI Banks on Tech, Resilience and People for Next Phase of Growth
With a legacy spanning over two centuries, the State Bank of India (SBI) has not only maintained its leadership in deposits as well as advances, but also shown the way to the banking industry. The Mumbai-headquartered bank has now identified technology, resilience and people as the three pillars for its next phase of growth.
read now
India's Best Banks
(2022)


Choosing the Champions
The insights and methodology behind the BT-KPMG India's Best Banks and NBFCs Survey 2023-24
By
Team BT and KPMG
After a six-month-long process of crunching numbers of banks and non-banking financial companies (NBFCs), the moment finally arrived to crown the champions of the 29th BT-KPMG India's Best Banks and NBFCs Survey 2023-24 this November.
A high-powered jury, led by Jayant Sinha, Former Chair of the Standing Committee on Finance and Former Minister of State for Finance, deliberated on the data. Other members included Subhash Chandra Garg, Former Economic Affairs Secretary; Dinesh Kumar Khara, Former Chairman of State Bank of India; Kalpana Morparia, Former Chair (South & Southeast Asia), J.P. Morgan; Gunit Chadha, Founder of APAC Financial Services; Alice G. Vaidyan, Former CMD of GIC; and A.P. Hota, former MD & CEO of NPCI.
Copyright© Living Media India Limited. For reprint rights: Syndications Today