A snapshot of how Indians earn and spend their income
A snapshot of how Indians earn and spend their income
BusinessToday.In
- May 18, 2018,
- Updated May 18, 2018 7:48 PM IST

- 1/10
As per Census 2011, the average household size in India is 4.8 people. While Tamil Nadu's average size is lowest in the nation, families in Uttar Pradesh, country's most densely populated state, have most number of members.
- 2/10
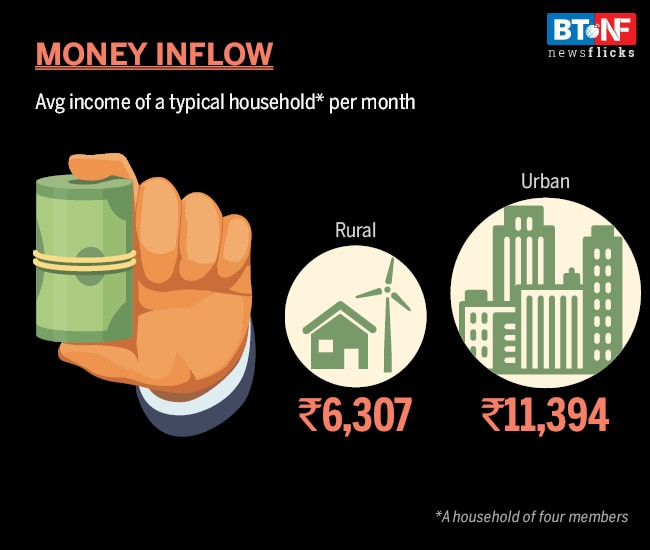
The average income of typical household in urban India is more than the rural areas. A study says the Indian middle class, who spend $2 and $10 per capita per day, doubled in size over an eight year period from 300 million in 2004 to 600 million in 2012.
- 3/10
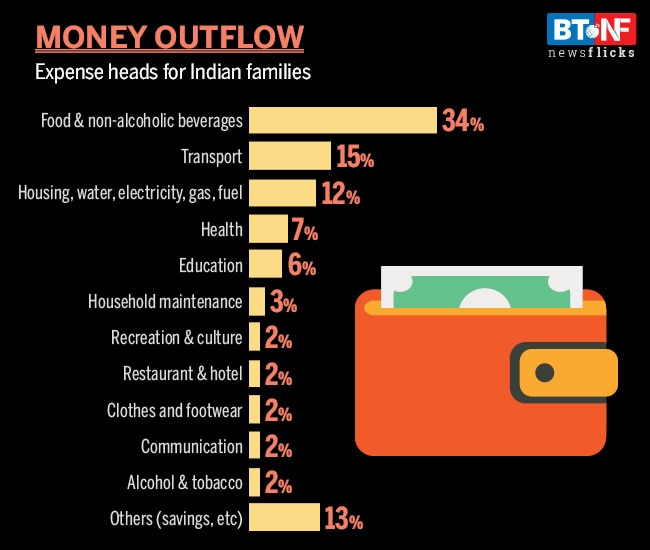
A surprising fact about spendings across India, rural households collectively spent more than their urban counterparts in 2015-16. The aggregate expenditure per household in the same year was Rs 42.2 trillion. Rural households accounted for 57% of the aggregate spending while urban ones accounted for 43%. Aggregate household expenditure was most on food and non-alcoholic beverages.
- 4/10
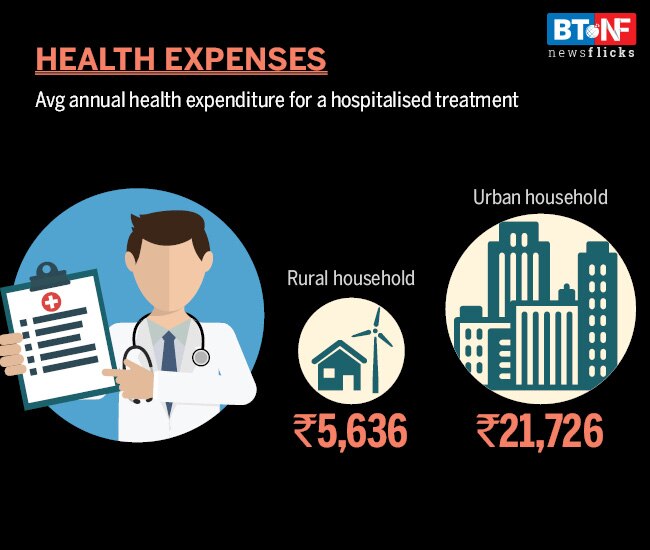
Indians spent just 1.3 per cent of its GDP on healthcare. This figure is much lower compared to BRICS countries - Brazil spends around 8.3 per cent, Russian Federation 7.1 per cent and South Africa around 8.8 per cent. In SAARC countries, Afghanistan spends 8.2 per cent, Maldives 13.7 per cent and Nepal 5.8 per cent.
- 5/10
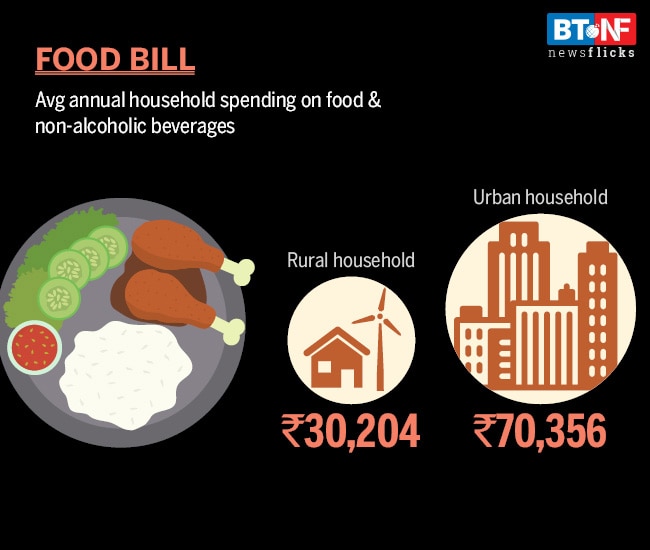
According to a UN report, an average American household spends $2,390 per year on food consumed at home, India spends around $446 (Rs 30,204) in rural areas and $1038.81 (Rs 70,356) in urban areas.
- 6/10
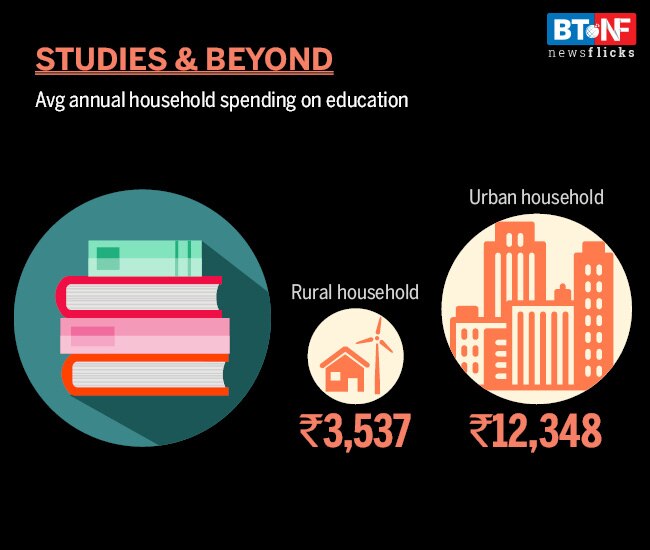
In this highly competitive world, education is highly prioritised by parents. An average urban Indian spends Rs 12,348 a year on education, while a rural Indian spends around Rs 3,537 a year. In comparison, Hong Kong residents shell out $132,161 (Rs 86 lakh) on their children's school or university tuition fees, books, transport and accommodation - the highest in the world. The world average is about $44,221 (Rs 29 lakh).
- 7/10
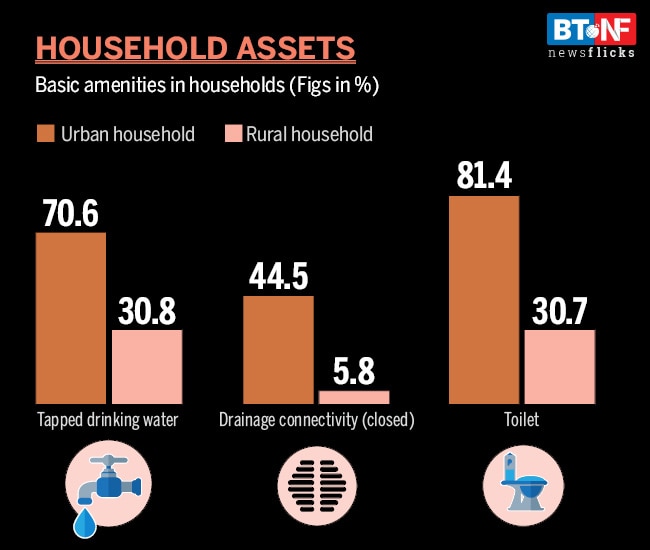
Water availability per capita has been going down due to the increase in population across India. The average annual per capita water availability has fallen from 2001 to 2011: 1,820 cubic metre and 1,545 m3, respectively.The NDA govt plans to provide 50% of all rural households with piped water and 35% of rural households with household taps by 2018.
- 8/10
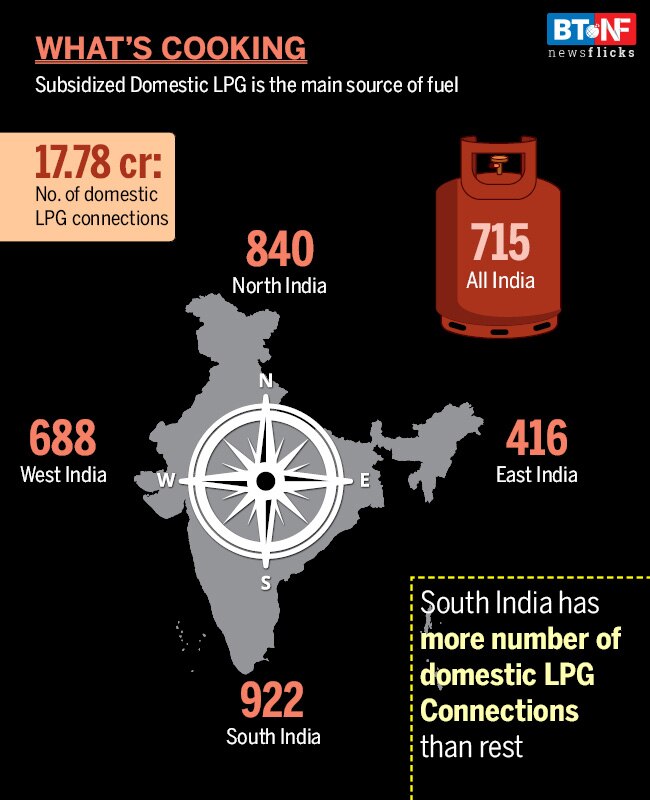
According to NSSO data 2011-12, of the total urban households in India, 71 per cent had an LPG connection, while 21 per cent in rural areas reported consumption of LPG for household use.Things changed after NDA govt launched Pradhan Mantri Ujjwala Yojana in May 2016, under which LPG connections were given to BPL families with a support of Rs 1,600 per connection. Nine crore new LPG connections have been distributed since 2014.
- 9/10
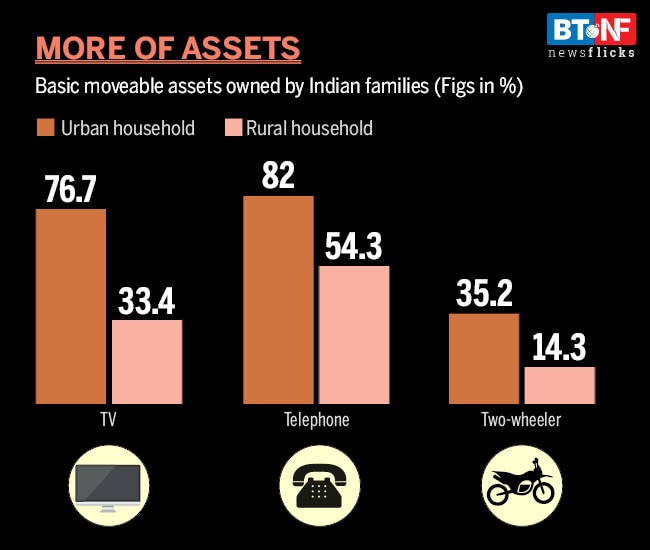
There has been a significant rise in the number of TV households in India in the past few years. According to Census 2011, the penetration was about 76.7% in urban areas, while in rural areas it was 33.4%. From 153 million TV households in 2011, it was about 183 million TV households in 2016.
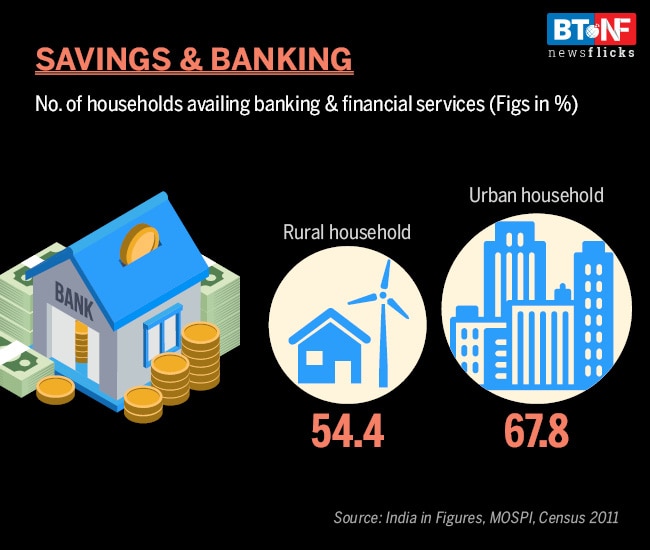
- 10/10
According to a survey based on Census 2011, 47 per cent of Indians had bank accounts, of which 50 per cent were dormant. The scenario changed after NDA brought in Pradhan Mantri Jan Dhan Yojana.In 2016, the 'Household Survey on India's Citizen Environment & Consumer Economy' stated that 99% of households in both rural and urban India have at least one member with a bank account.