Ten key takeaways from Economic Survey 2019-20
Ten key takeaways from Economic Survey 2019-20
BusinessToday.In
- Jan 31, 2020,
- Updated Jan 31, 2020 7:45 PM IST

- 1/10
Entrepreneurship & Wealth creation
The focus of the Survey was on wealth creation. According to the Survey, India ranks third in number of new firms created, as per the World Bank. New firm creation in India has increased dramatically since 2014. There has been a 12.2 % cumulative annual growth rate of new firms in the formal sector during 2014-18, compared to 3.8 % during 2006-2014. About 1.24 lakh new firms were created in 2018, an increase of about 80 % from 70,000 in 2014. The survey examines the content and drivers of entrepreneurial activity at the bottom of the administrative pyramid - over 500 districts in India.

- 2/10
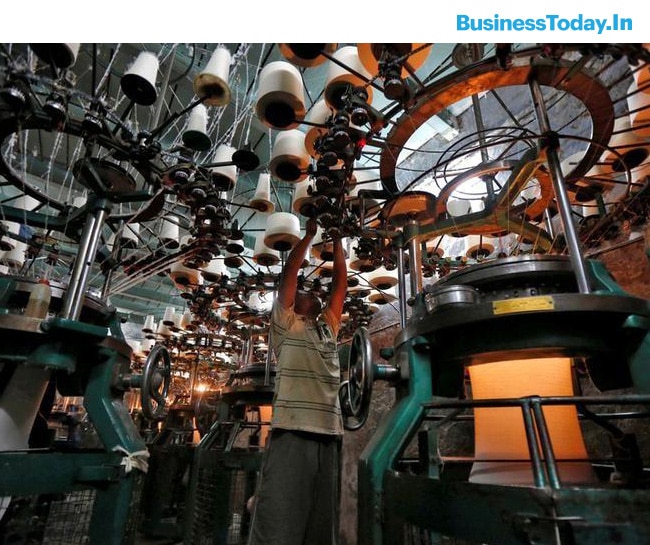
Creating Jobs and growth by specializing in Network Products
Survey says India has unprecedented opportunity to chart a China-like, labour-intensive, export trajectory. By integrating "Assemble in India for the world" into Make in India, India can raise its export market share to about 3.5 % by 2025 and 6 % by 2030 and also create 4 crore well-paid jobs by 2025 and 8 crore by 2030. Exports of network products can provide one-quarter of the increase in value added required for making India a $5 trillion economy by 2025. Survey suggests a strategy similar to one used by China to grab this opportunity.
- 3/10
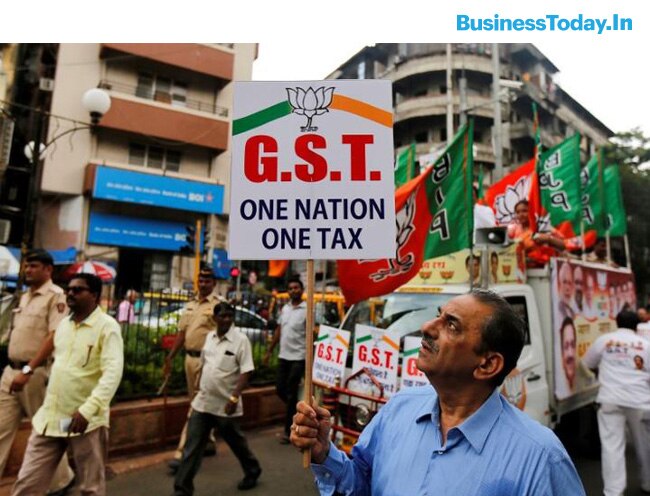
Targeting Ease of Doing Business in India
It mentioned a jump of 79 positions to 63 in 2019 from 142 in 2014 in World Bank's Doing Business rankings. India still trails in parameters such as Ease of Starting Business, Registering Property, Paying Taxes and Enforcing Contracts. The turnaround time of ships in India has almost halved to 2.48 days in 2018-19 from 4.67 days in 2010-11.
- 4/10
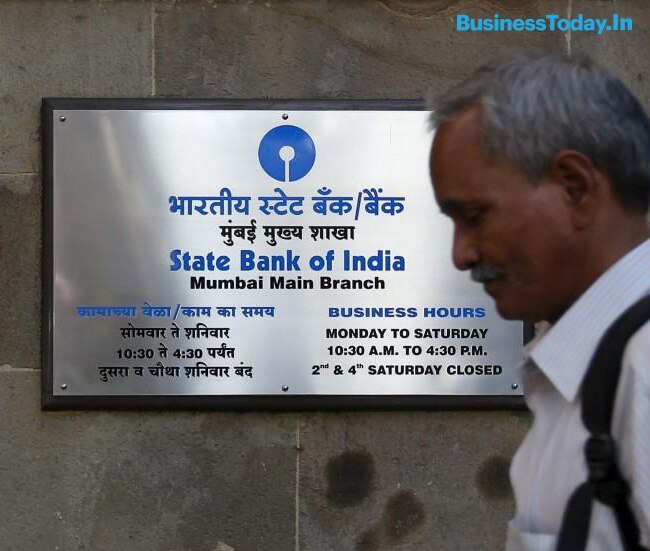
Golden jubilee of bank nationalisationSurvey observes 2019 as the golden jubilee year of bank nationalization. Accomplishments of lakhs of Public Sector Banks (PSBs) employees cherished and an objective assessment of PSBs suggested by the Survey. Since 1969, India's Banking sector has not developed proportionately to the growth in the size of the economy. India has only one bank in the global top 100 - same as countries that are a fraction of its size: Finland (about 1/11th), Denmark (1/8th), etc.
- 5/10
Privatization and Wealth Creation
Survey examines the realised efficiency gains from privatization in the Indian context and bolsters the case for aggressive disinvestment of CPSEs. Strategic disinvestment of Government's shareholding of 53.29 per cent in HPCL led to an increase of around Rs. 33,000 crore in national wealth. Survey presents an analysis of the before-after performance of 11 CPSEs which underwent strategic disinvestment from 1999-2000 to 2003-04.
- 6/10
Is India's GDP Growth Overstated? No!
GDP growth is a critical variable for decision-making by investors and policymakers. Therefore, the recent debate about accuracy of India's GDP estimation following the revised estimation methodology in 2011 is extremely significant. As countries differ in several observed and unobserved ways, cross-country comparisons have to be undertaken by separating the effect of other confounding factors and isolating effect of methodology revision alone on GDP growth estimates. Models that incorrectly over-estimate GDP growth by 2.7 % for India post-2011 also misestimate GDP growth over the same period for 51 out of 95 countries in the sample. Several advanced economies such as UK, Germany and Singapore have their GDPs misestimated with incompletely specified econometric model. Correctly specified models that account for all unobserved differences and differential trends in GDP growth across countries fail to find any misestimating of growth in India or other countries. Concerns of a misestimated Indian GDP are unsubstantiated by the data and are thus unfounded.
- 7/10
India's Economic Performance in 2019-20
India's GDP growth moderated to 4.8 % in H1 of 2019-20, amidst a weak environment for global manufacturing, trade and demand. Real consumption growth has recovered in Q2 of 2019-20, cushioned by a significant growth in government final consumption. Growth for 'Agriculture and allied activities' and 'Public administration, defense, and other services' in H1 of 2019-20 was higher than in H2 of 2018-19. India's external sector gained further stability in H1 of 2019-20: Current Account Deficit (CAD) narrowed to 1.5 % of GDP in H1 of 2019-20 from 2.1 % in 2018-19.
- 8/10
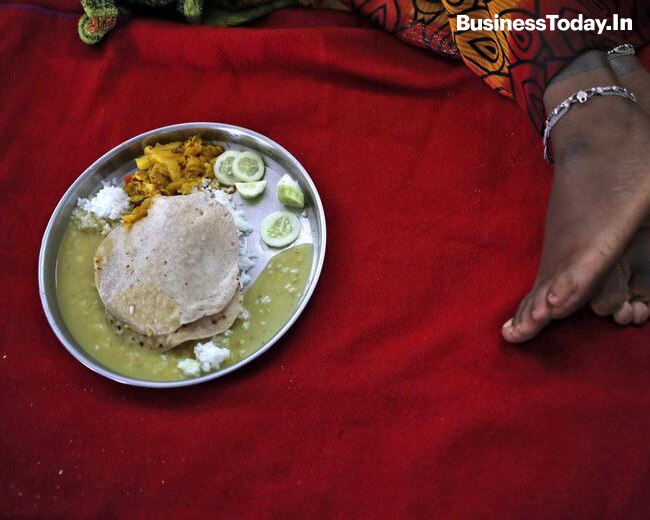
Thalinomics: The Economics of a Plate of Food in India
The Economic Survey has introduced the concept of Thalinomics. It is an attempt to quantify what a common person pays for a Thali across India. There was a shift in the dynamics of Thali prices since 2015-16. .Absolute prices of a vegetarian Thali have decreased significantly since 2015-16 across India and the four regions; though the price has increased during 2019-20.
Post 2015-16:- Average household gained close to Rs. 11, 000 on average per year from the moderation in prices in the case of vegetarian Thali.
- Average household that consumes two non-vegetarian Thalis gained close to Rs. 12, 000 on average per year during the same period.
- Affordability of vegetarian Thalis improved 29 %.
- Affordability of non-vegetarian Thalis improved by 18 %.
- 9/10
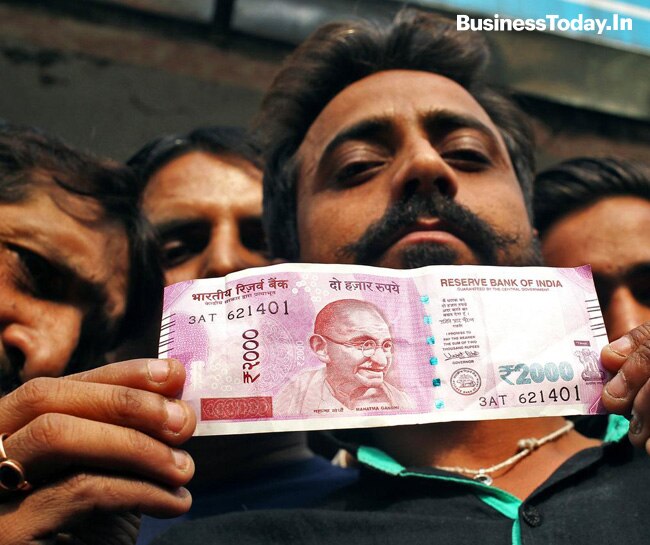
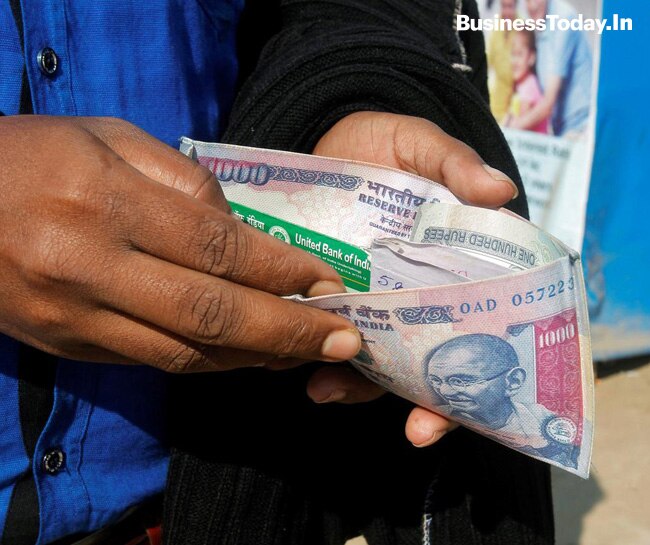
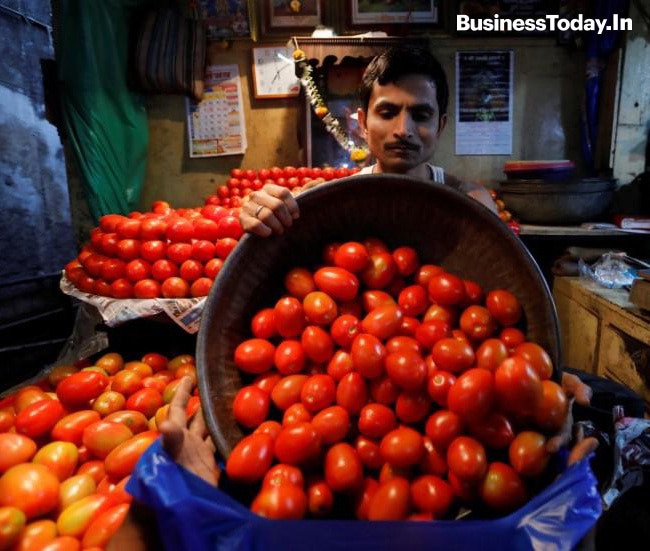
Prices and Inflation
Inflation Trends: Inflation has witnessed moderation since 2014. Consumer Price Index (CPI) inflation increased from 3.7 per cent in 2018-19 (April to December, 2018) to 4.1 per cent in 2019-20 (April to December, 2019). WPI inflation fell from 4.7 per cent in 2018-19 (April to December, 2018) to 1.5 per cent during 2019-20 (April to December, 2019).

- 10/10
Social Infrastructure, Employment and Human Development
The expenditure on social services (health, education and others) by the Centre and States as a proportion of GDP increased from 6.2 % in 2014-15 to 7.7 % in 2019-20 (BE). India's ranking in Human Development Index improved to 129 in 2018 from 130 in 2017: With 1.34 % average annual HDI growth, India is among the fastest improving countries.