Support and resistance levels are the prices that a stock or an index are unlikely to breach. These are derived from the technical analysis of stocks and indices. The support level is one below which a stock is unlikely to fall. This is because the analysis of the historical price movement of that stock has shown that at that particular price level, there was a surge of interest among buyers. As a result, the stock usually bounces back after hitting this crucial price level. Like stocks, an index can also have a support level.
| The stock fell to its support in January and February, but bounced back each time. Selling pressure broke down the support in March and it fell to the next level. |
| The stock faced resistance at Rs 60 and fell back after touching it once in February. The next time it crossed the resistance level in March and shot up decisively. |
There can be multiple support levels for a stock. Widespread selling can cause a stock (or index) to break one support and seek a new one at a lower level. As soon as the support level is crossed, the share price goes into a free fall until it reaches the next support level. This sharp fall usually occurs because a lot of investors exit from the stock as soon as the support level is breached.
In the hypothetical example (see graph), the stock was quoting at Rs 120 and reached its first support of Rs 100 and then Rs 80. The stock fell to Rs 100 twice and managed to bounce back each time. But the selling pressure broke down the support level and the stock fell below Rs 100, coming all the way down to Rs 80. At such a level, buyers in large numbers usually step in because the price seems attractive.
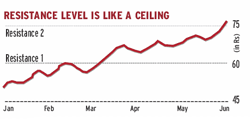
Resistance is the opposite of support. It is the level which is difficult for a stock or an index to cross. While the support level acts as a floor, the resistance is the ceiling for the stock price. If the support level signifies a buying opportunity, the resistance level is time to book profits. A lot of investors tend to sell when a resistance level is reached, triggering a decline in the stock price.
After a stock falls below the support level, this price becomes the resistance level. A stock usually finds it difficult to cross this price level once it has fallen decisively below it.
It’s not as if this ceiling cannot be breached. If a stock crosses the resistance, it usually sees a sudden surge in interest in investors and the stock price shoots up. Here again, a new resistance level is set at higher levels once the stock crosses the previous price hurdle. In the given example, the stock faced resistance at Rs 60 and fell back after touching it. The next time it cleared the level and shot up decisively till it touched the second resistance level at Rs 75.
Technical indicators such as support and resistance levels are only for the short term. They are immaterial when it comes to long-term investments. For long-term investors, fundamentals are more meaningful than technicals.