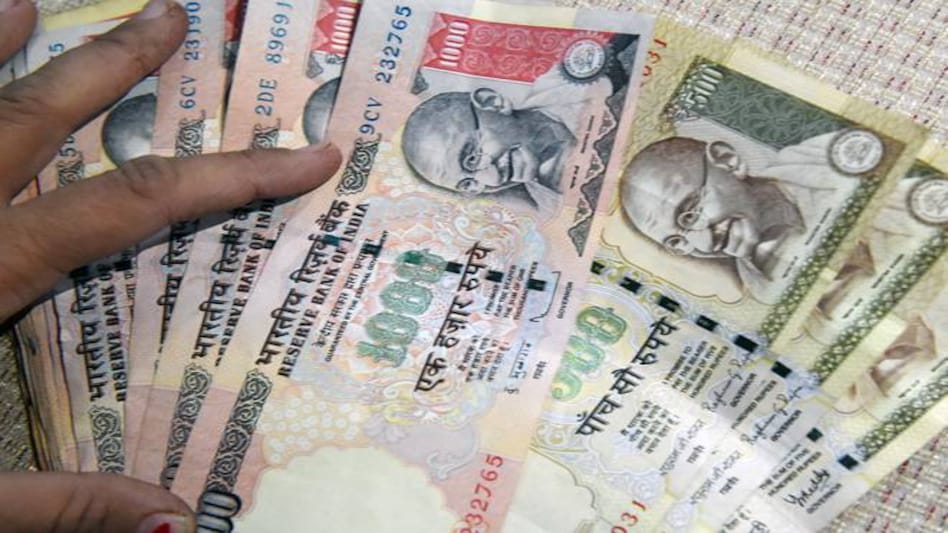


On November 8, 2016, at 20:00 hrs, through an unscheduled live television feed, Prime Minister Narendra Modi announced demonetisation of all Rs. 500 and Rs. 1000 banknotes. The move led to chaos in the country as the demonetised currency accounted for 86 per cent of the cash supply by value in the Indian economy. Note ban led to shortage of cash for the common man and corporates alike. In fact, India Inc is still recovering from the cash crunch. Comparing the financials of FY18, FY17 and FY16 for Nifty 500 companies showed that these firms are still reviving from the effects of demonetisation.
Inventory turnover ratio: Also known as stock turnover ratio, it is an efficiency ratio which measures how fast company is selling its inventory. In 2016, the average inventory turnover was 149.5 times which declined to 75.49 in 2017 and further declined to 59.5 in 2018 for Nifty 500 companies. The fall in inventory turnover ratio implies weaker sales and rise in the excess inventory held by companies.
Debtors turnover ratio: It is also known as receivables turnover ratio. It measures how many times receivables are collected during a particular period, where receivables include trade debtors and bills receivables. In 2016, debtors turnover ratio stood at 85.41 times, which fell to 46.08 times in 2017. There was a slight increase in the debtors turnover ratio in 2018 where it rose to 50.67 times. A decrease in debtors turnover ratio depicts inability to collect cash from debtors which is a direct implication of demonetisation.
Inventory days: Inventory days ratio is an efficiency ratio which measures the average number of days inventory is held by the company before selling it. This ratio is an indicator of the number of days funds are stuck in inventory. In 2016, the inventory days were 62.95 which rose marginally to 67.61 in 2017. In 2018, the inventory days shot up to 87.11 days. The increase in the number of inventory days represents lesser demand of the goods and services by the market.
Payable days: Payable days represent the average number of days the company takes to pay its suppliers. It is an important part of the cash cycle. In 2016, the average payable days for Nifty 500 companies were 64.44 days which marginally fell to 66.88 days in 2017. However in 2018, the payable days increased to 71.98 days.
For the 26 out of the Nifty 500 companies which released their 2018 financial reports excluding banks which struggled to cope with the RBI's guidelines for NPA (non performing assets) following were the key findings:
PAT (profit after tax) for these companies grew at a slower pace of 6.66 per cent in FY18 as compared to 11.385 per cent in FY17. Cash profits for companies decreased from 10.30 per cent in FY17 to 7.25 per cent in FY 18. Creditors increased from 19.25 per cent to 28.57 per cent in FY18. Debtors showed a steep increase from 6.7 per cent in FY17 to 24.05 per cent in FY18.
Conclusion:
Performance of Nifty was impacted as it can be derived from the Nifty 500 financial indicators. Demonetisation and GST still have their lingering effects on the Indian economy as the Nifty 500 companies are struggling to cope with the cash shortages to meet their working capital requirements. However, recently World Bank, IMF and Asian development Bank (ADB) reports stated that Indian economy is recovering from the effects of demonetisation and GST as structural policy effects are beginning to fade away. World bank and ADB forecast Indian economy to grow at 7.3% this fiscal.
Copyright©2025 Living Media India Limited. For reprint rights: Syndications Today


